Enhance your bowtie diagram with LOPA
LOPA takes your bowtie diagrams further by using quantitative data to evaluate how effectively barriers prevent or mitigate the top event. It helps ensure the risk of the top event and its consequences is reduced to a tolerable level through sufficient, effective protection layers.
In this tutorial, we’ll cover editing the main LOPA settings, assigning initiating frequencies to threats, adding PFDs to barriers, quantifying the likelihood of occurrence, colour coding barrier failure rates and comparing consequences to target frequencies.
Edit the main LOPA settings
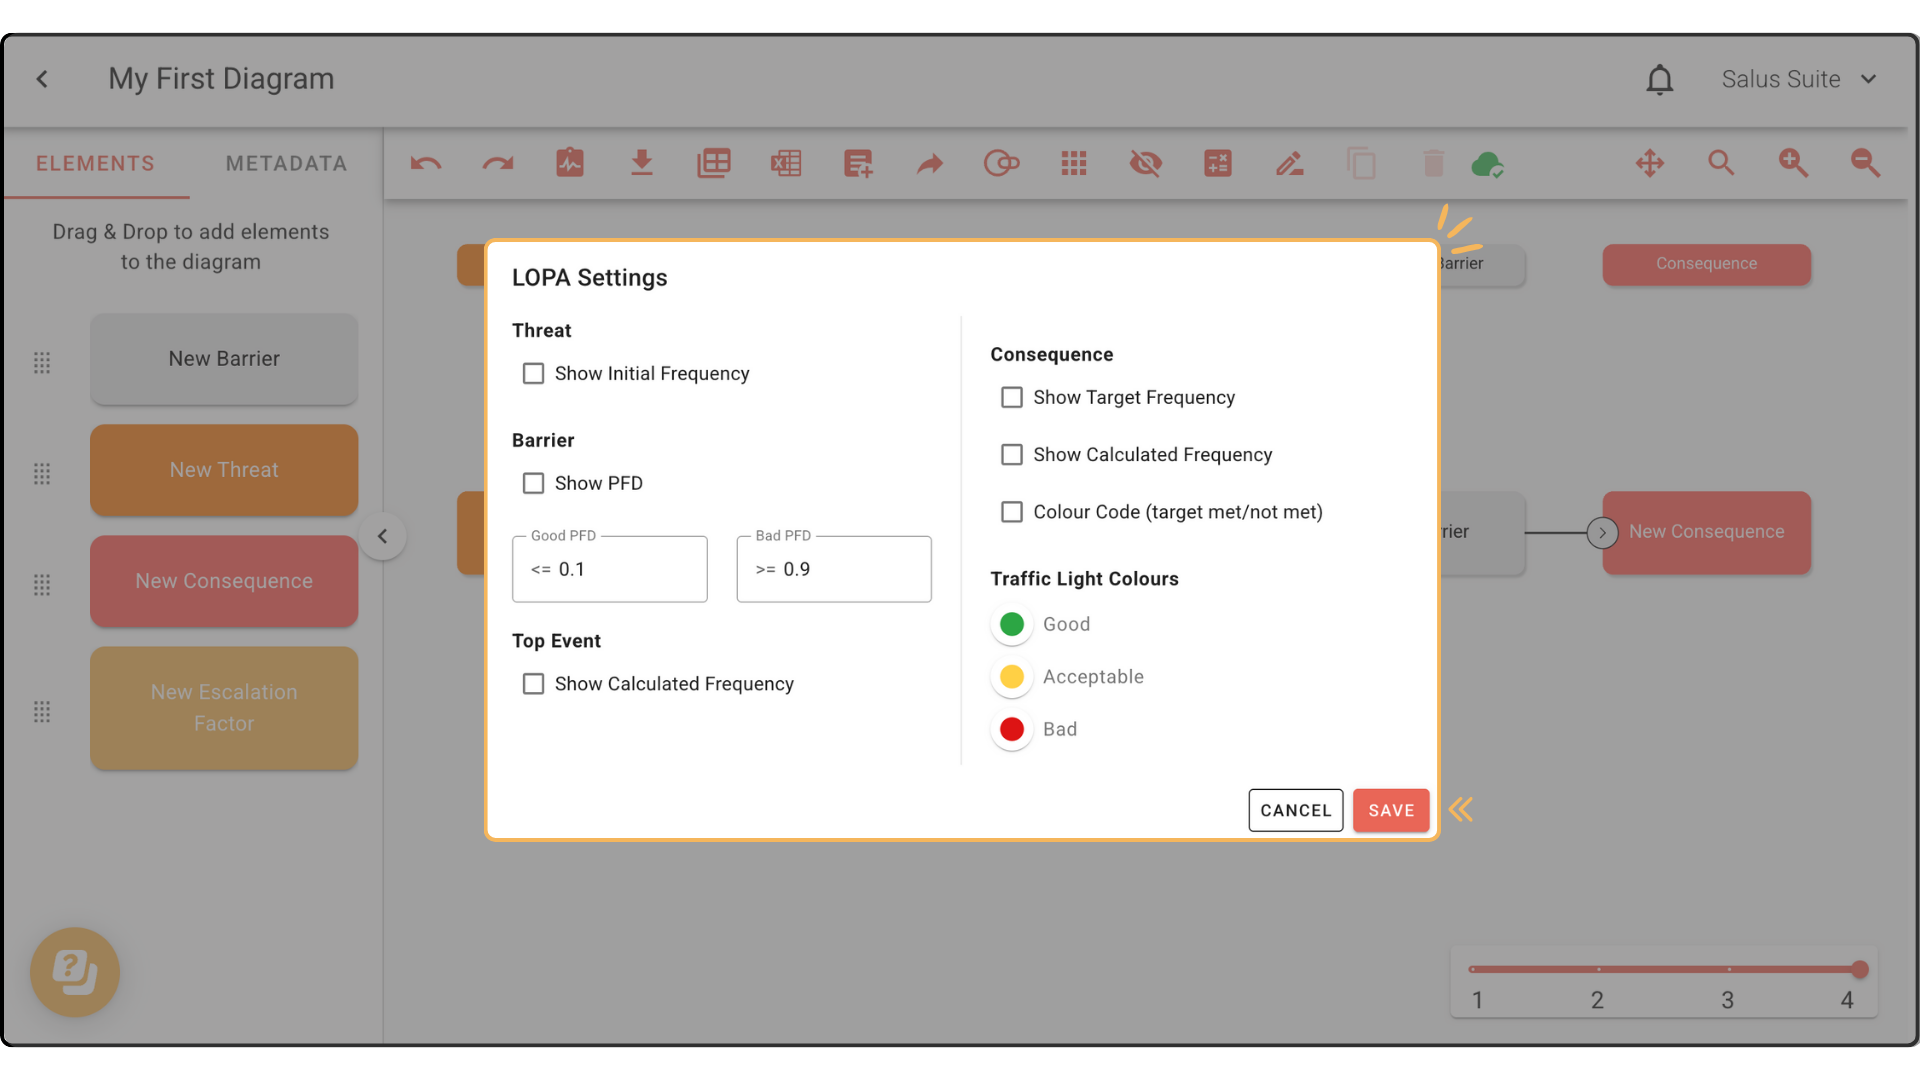
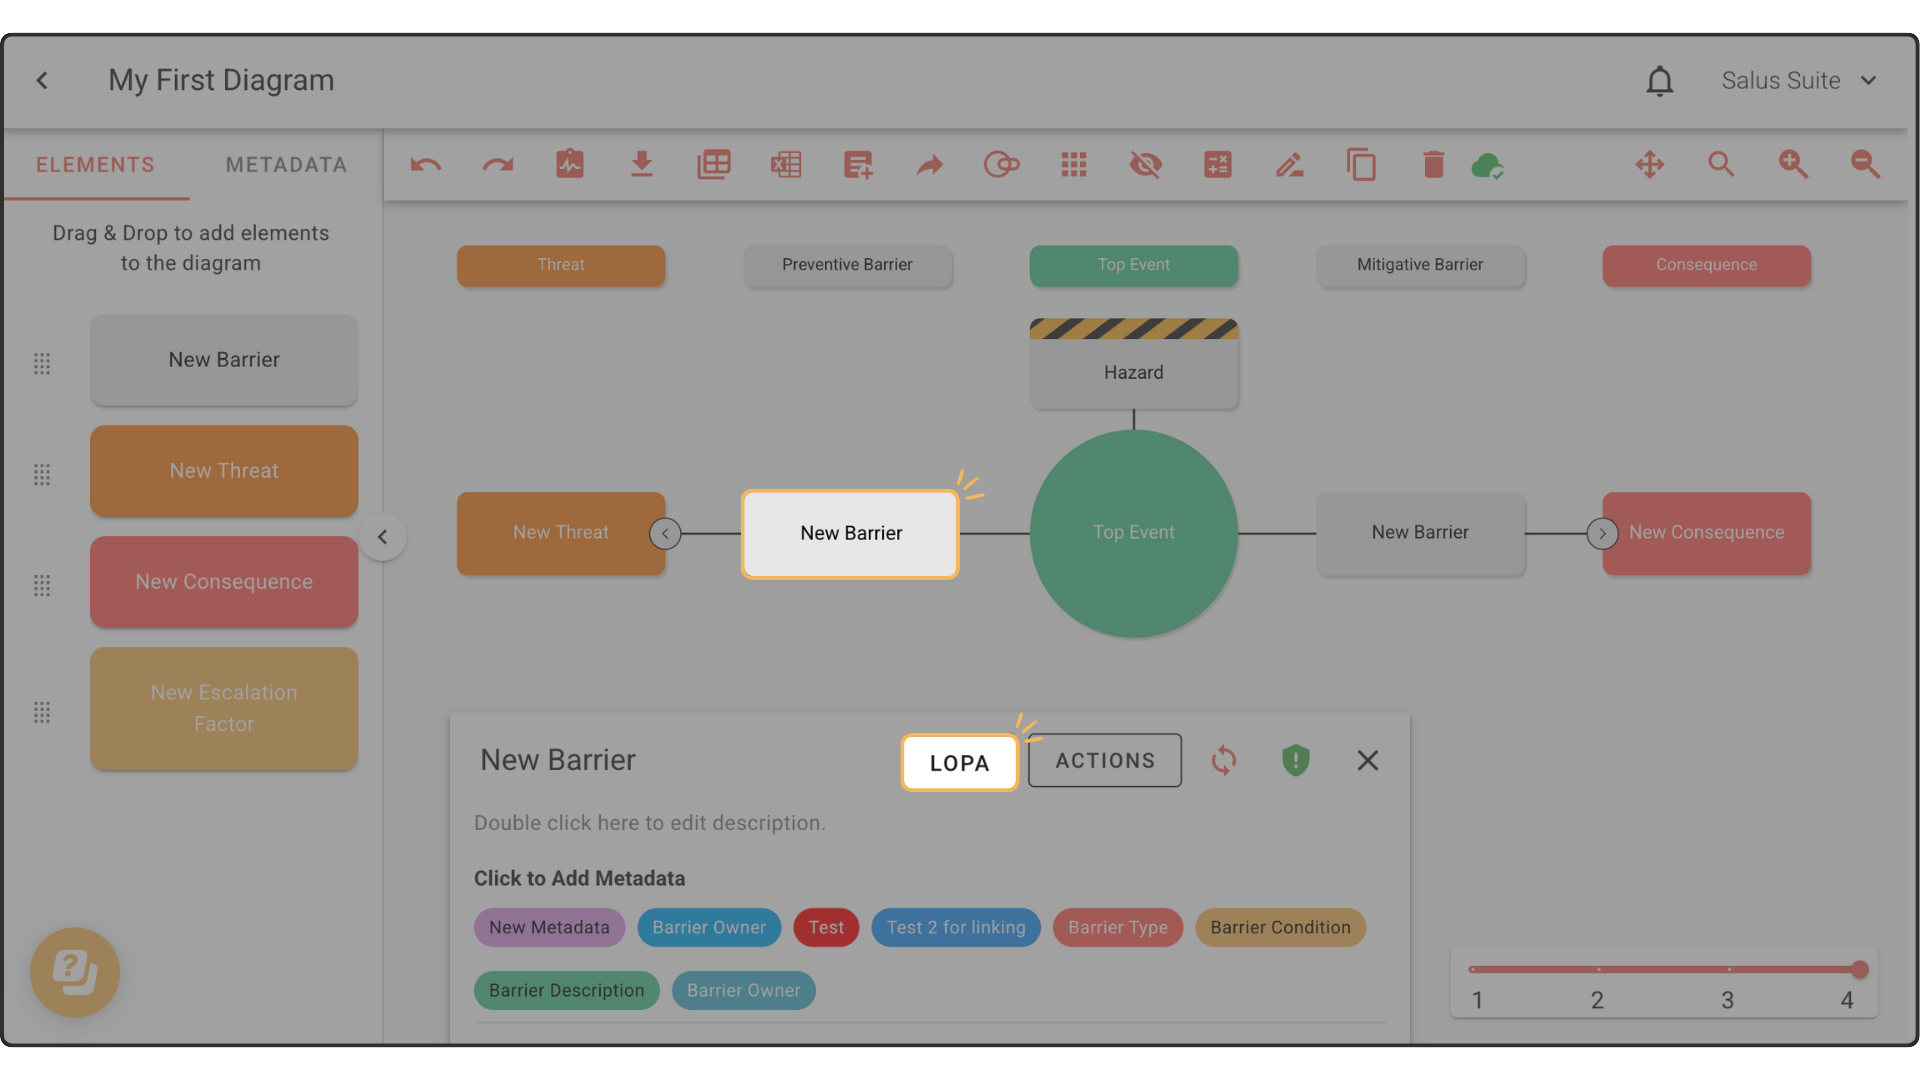
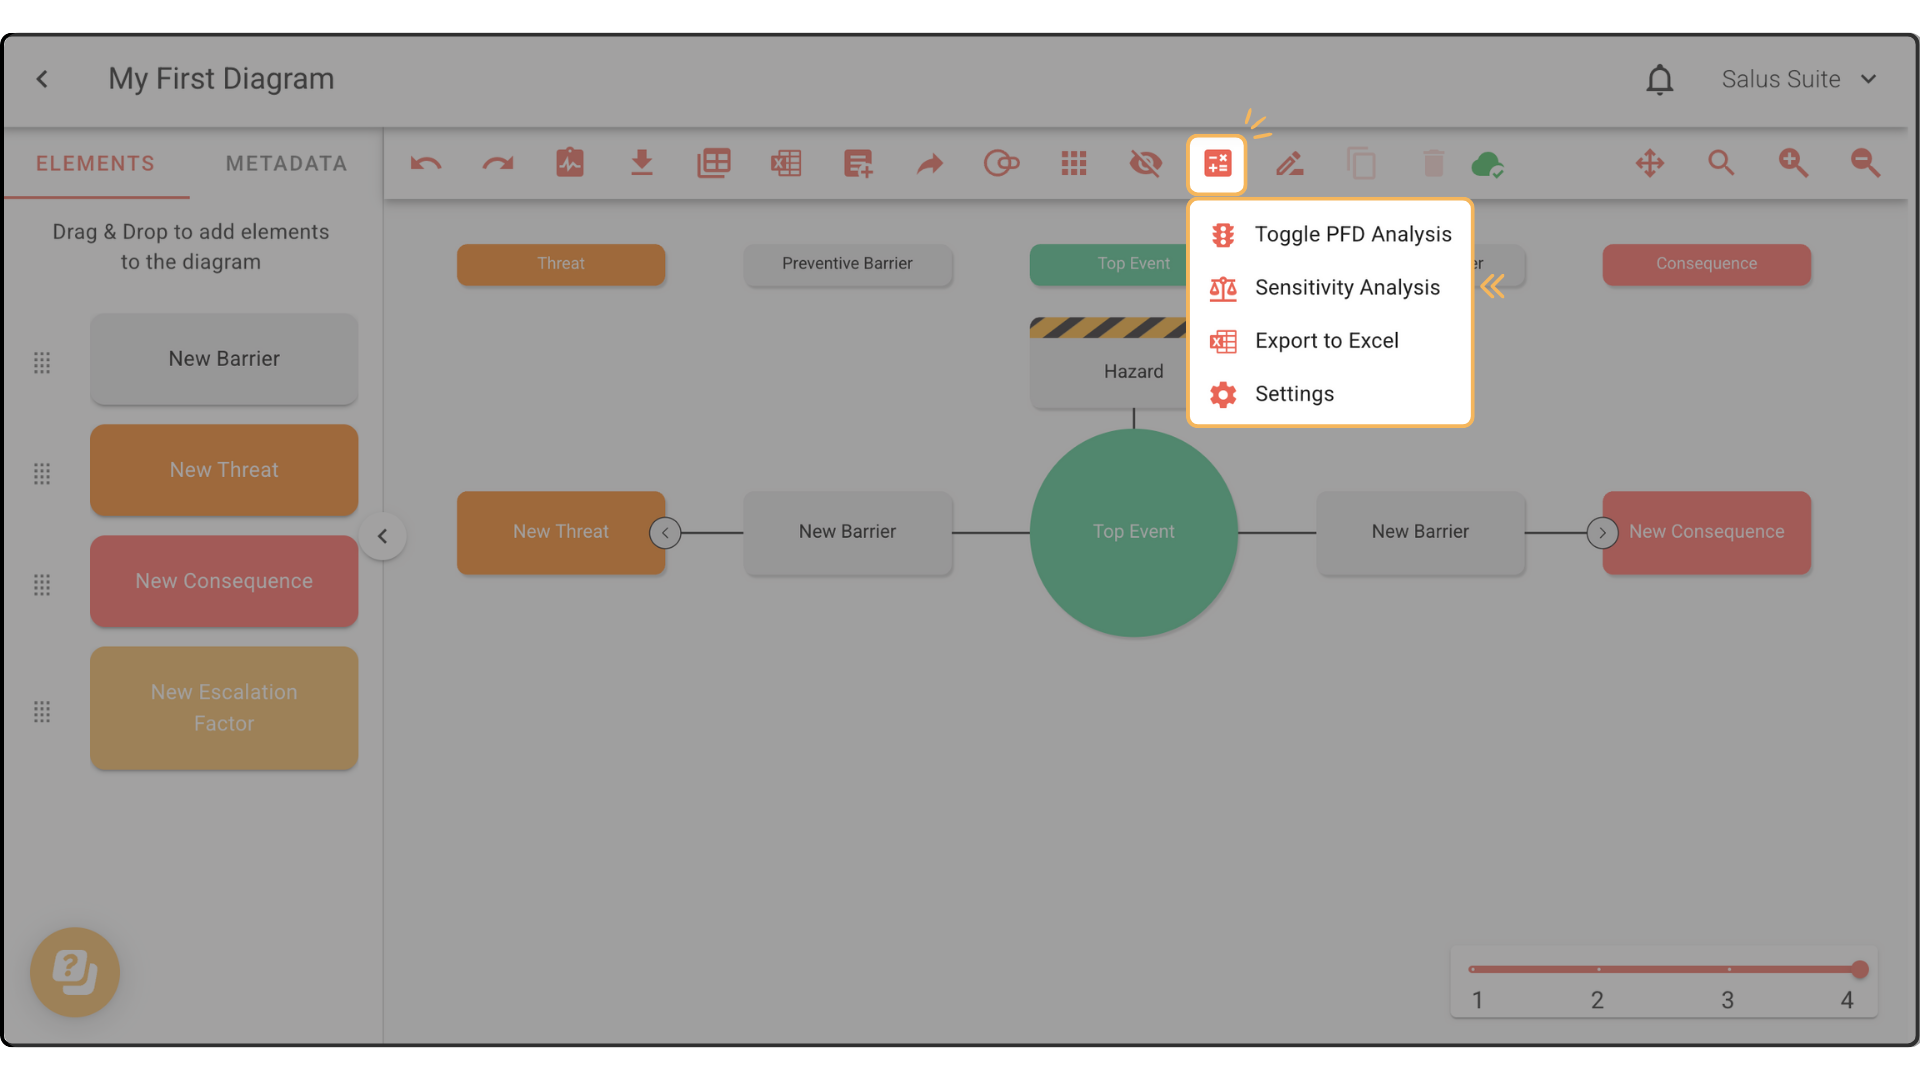
Step 1: In the Diagram Editor, click LOPA, then SETTINGS.

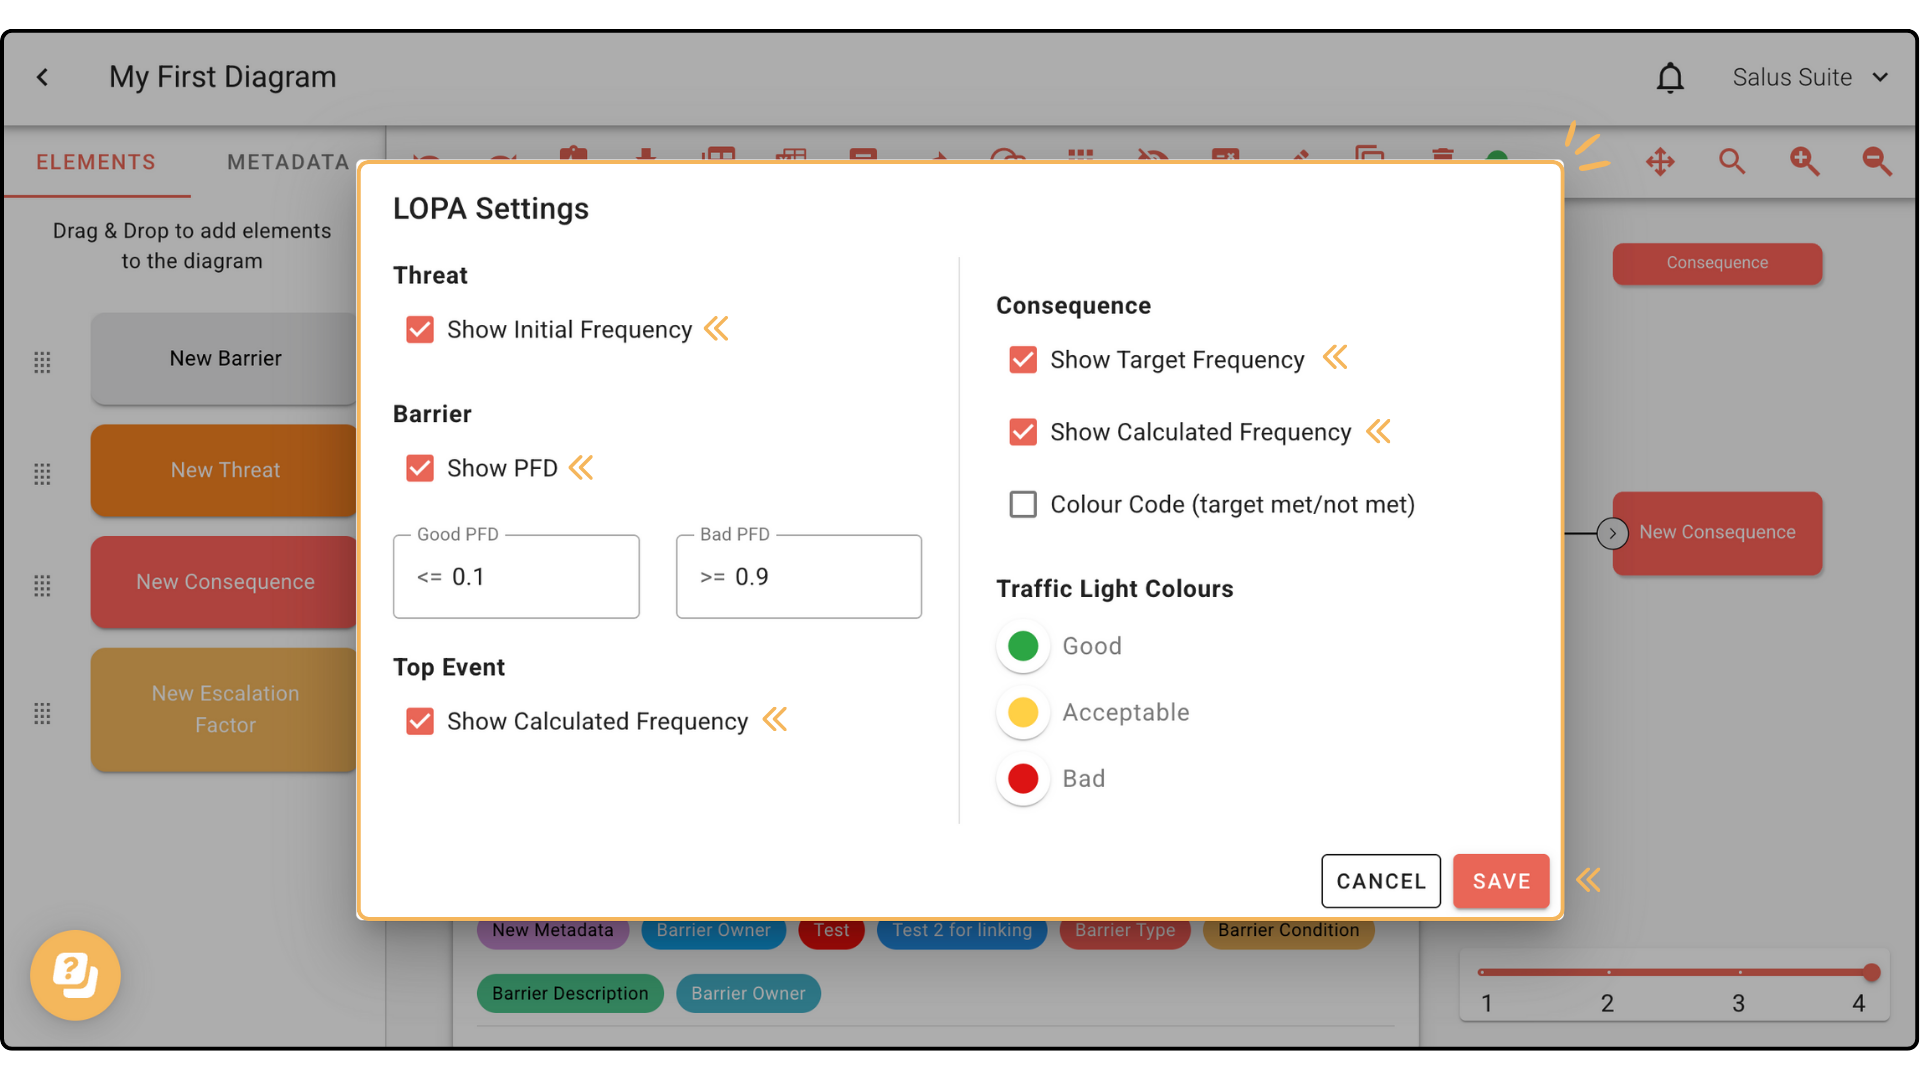
Step 2: In the LOPA Settings pop-up, show or hide frequency figures and set the Good and Bad PFDs (Probability of Failure on Demand).
Assign initiating frequencies to threats
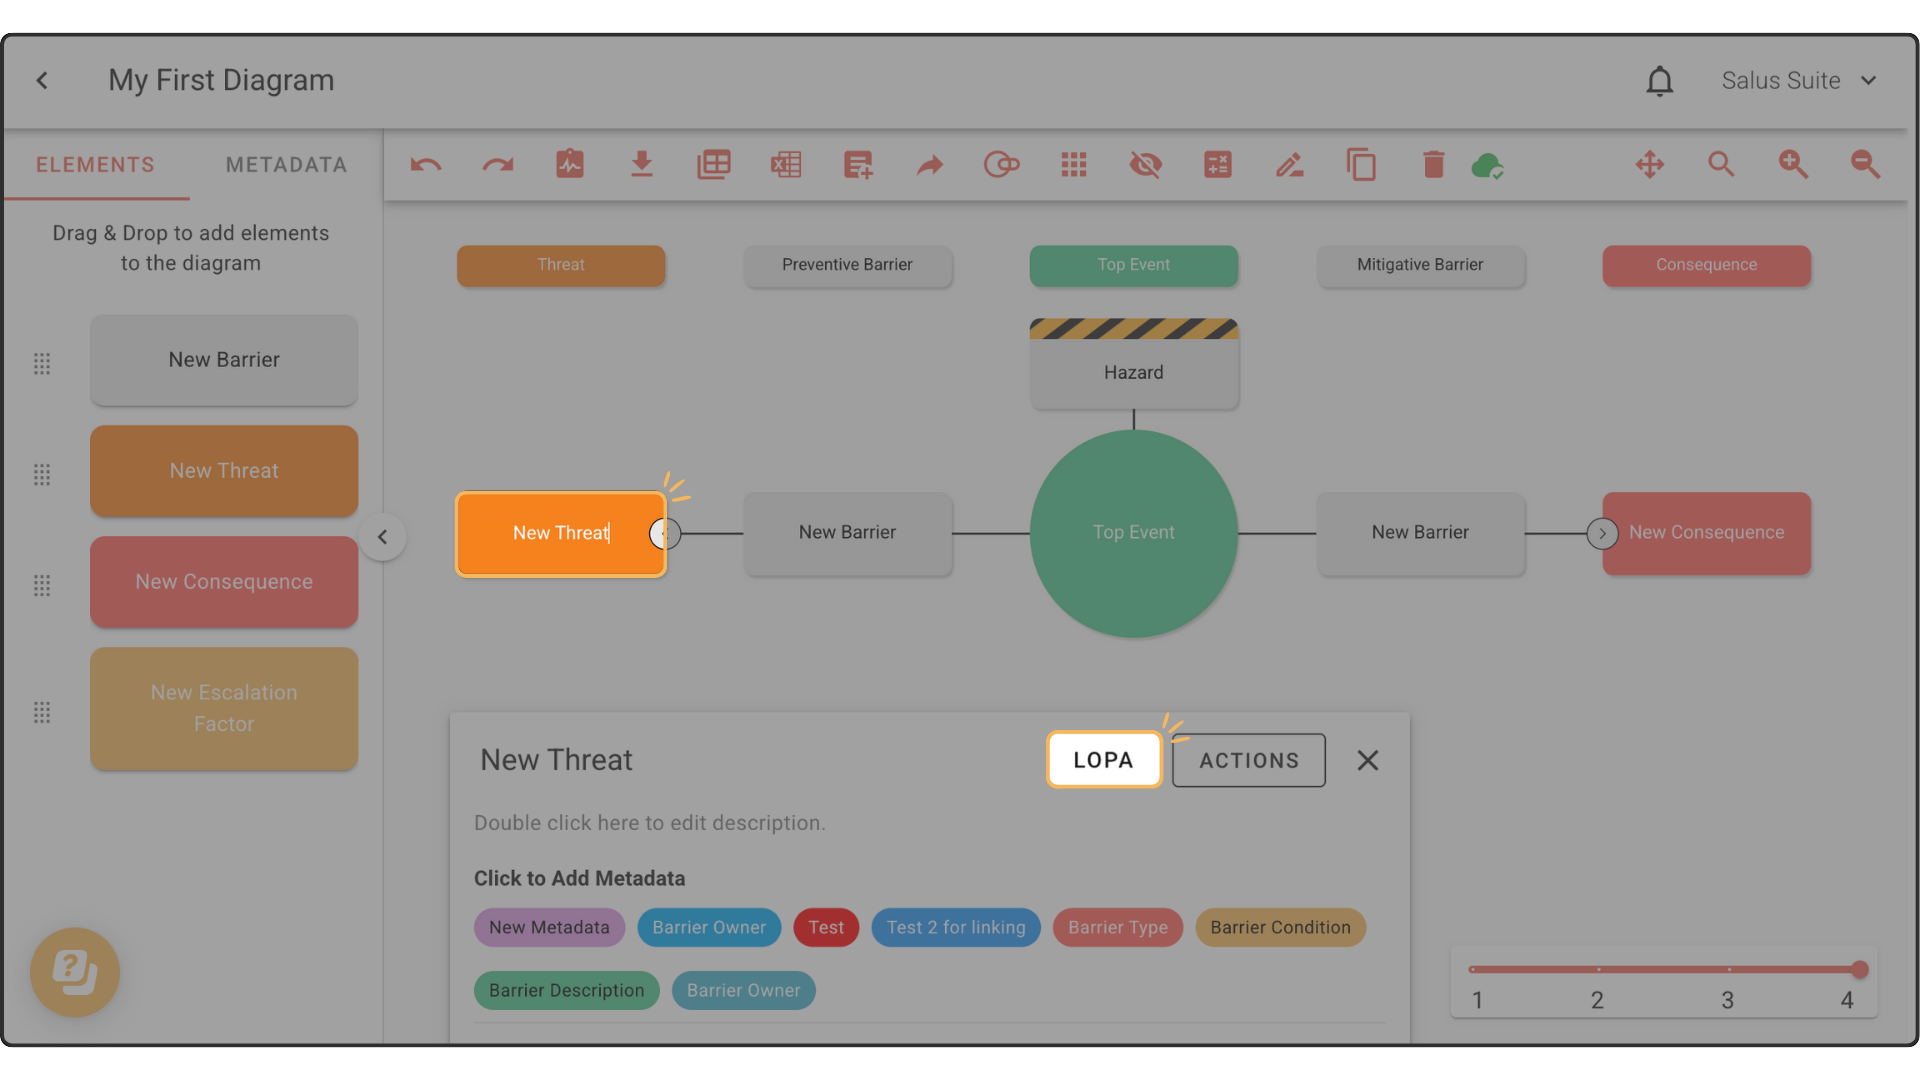
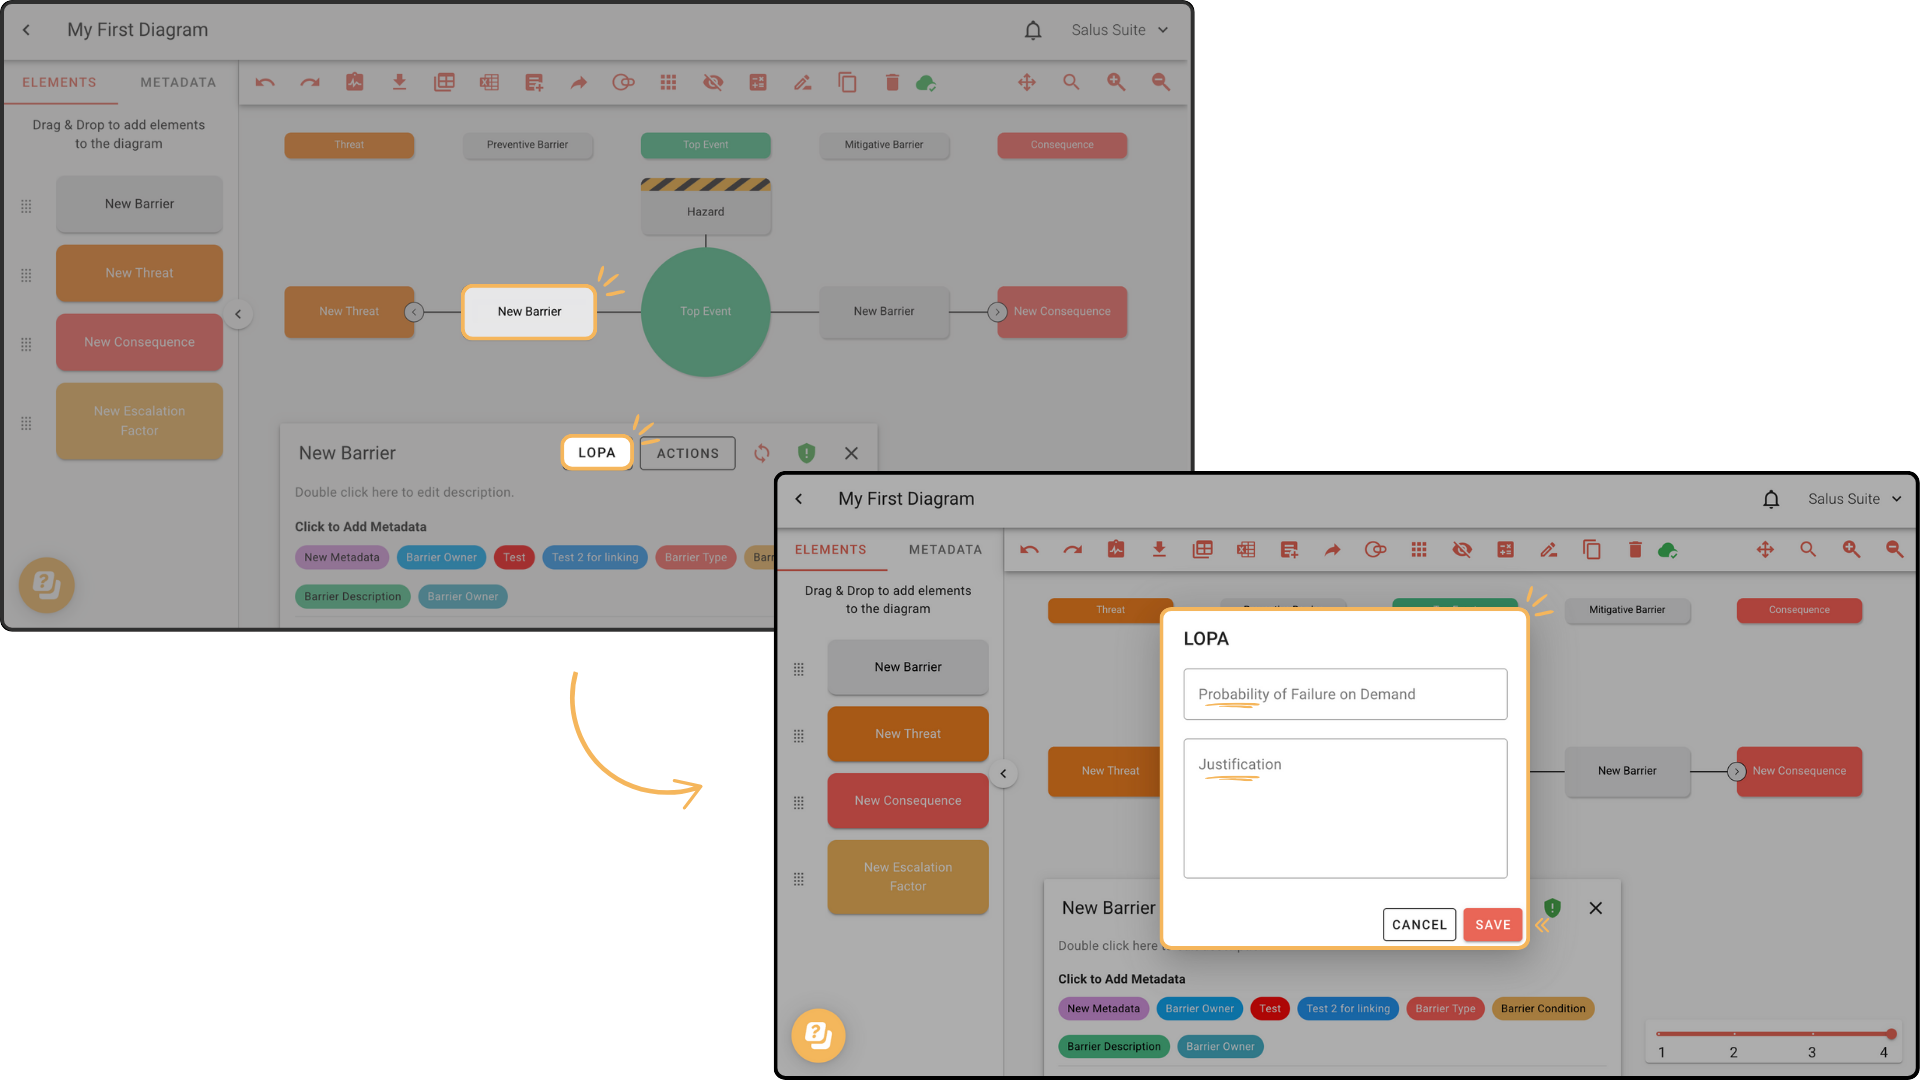
Step 1: Select the threat. A tab opens at the bottom of the Diagram Editor. Click LOPA.
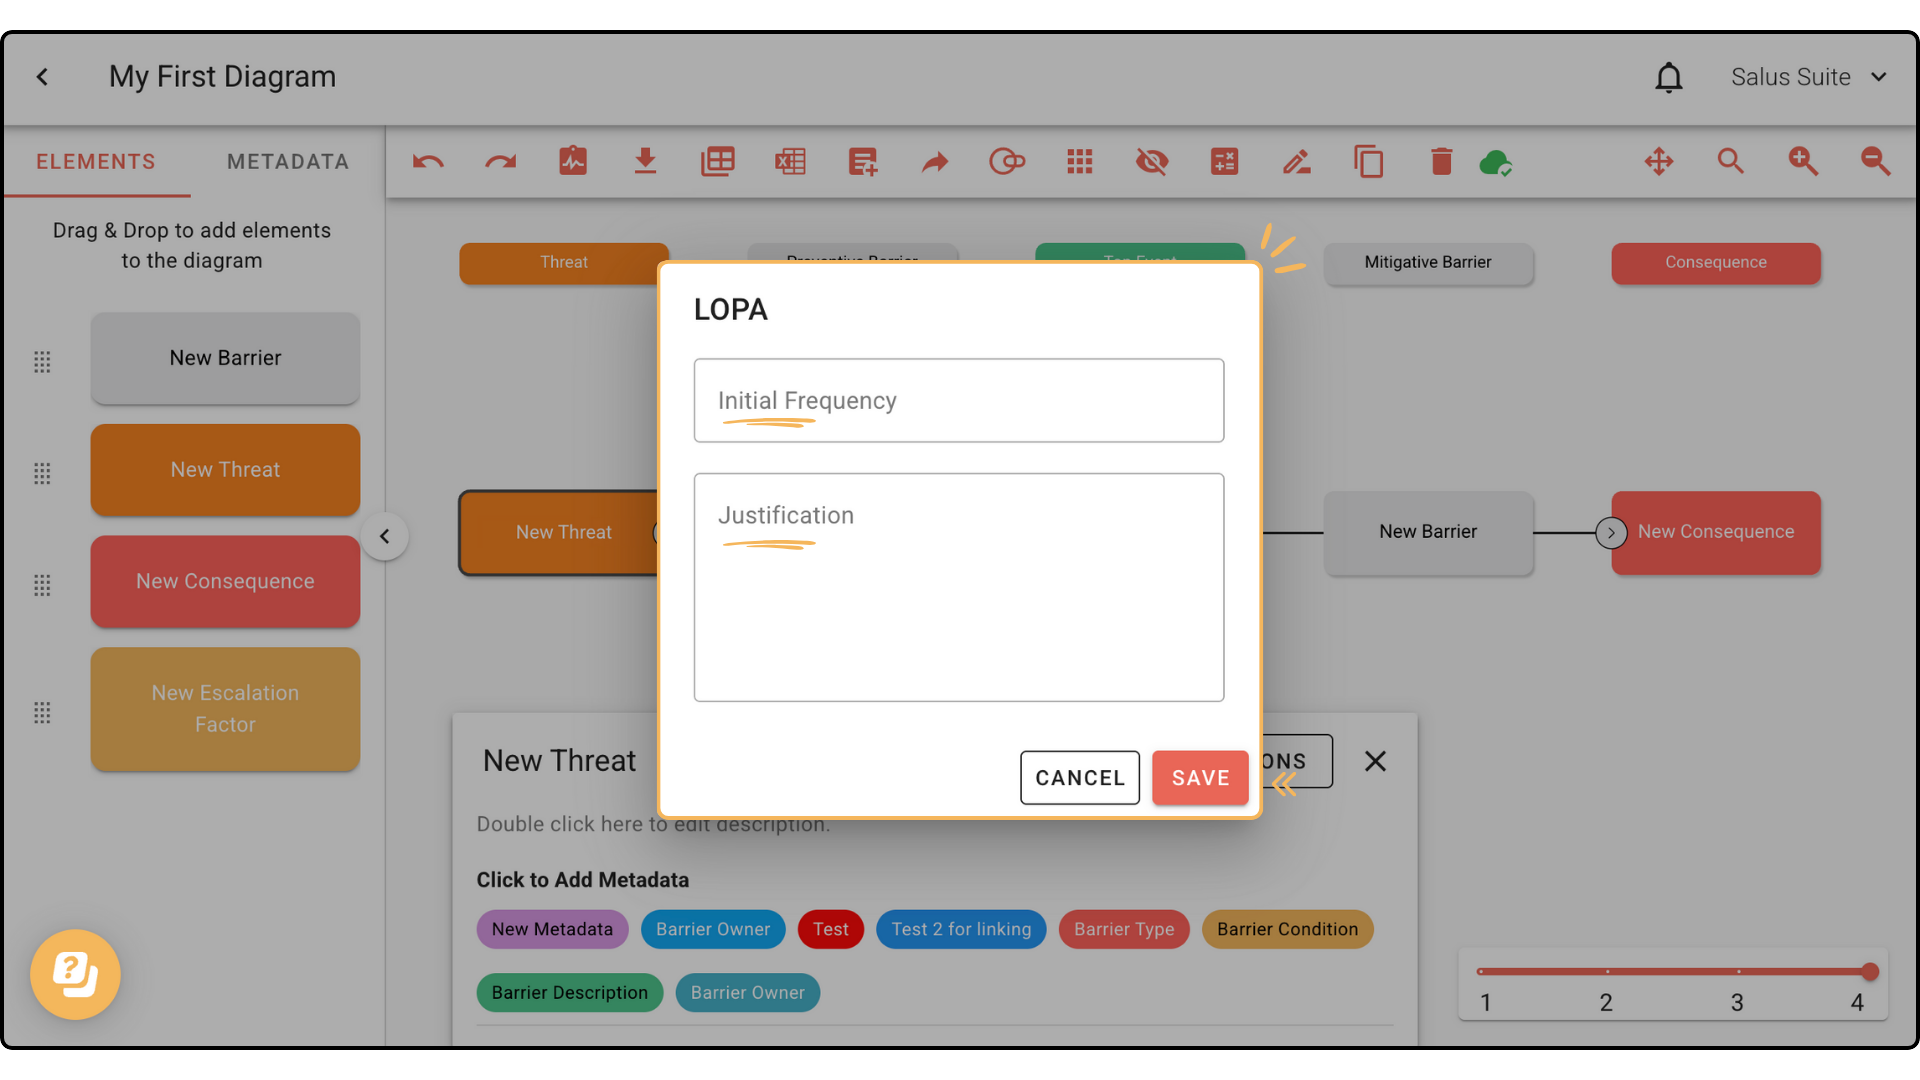
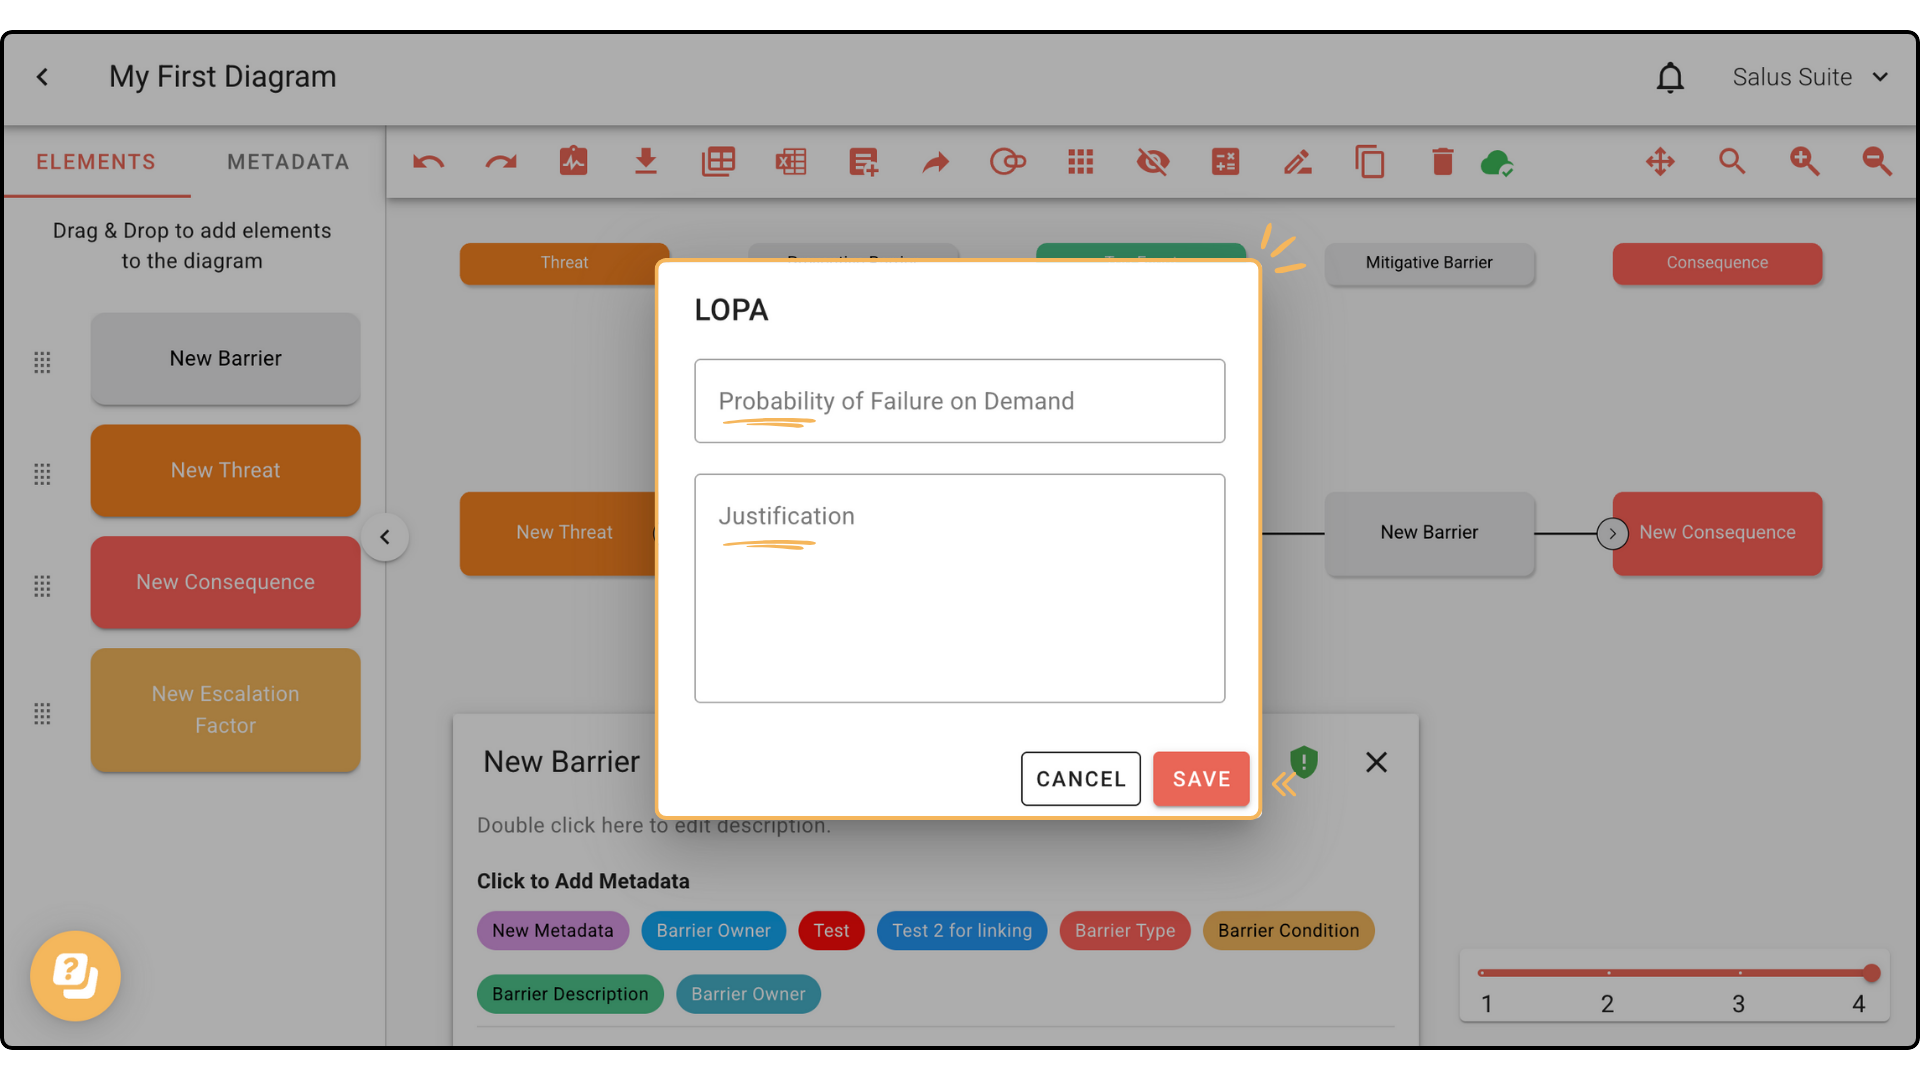
Step 2: Add the Initial Frequency and an optional Justification, then click SAVE. The value appears in the element.
Add a PFD to each barrier
Step 1: Select the barrier. A tab opens at the bottom of the Diagram Editor. Click LOPA.
Step 2: Add the PFD and an optional Justification, then click SAVE.
Quantify the likelihood of occurrence
Step 1: Click LOPA, then SETTINGS.

Step 2: Set the Good and Bad PFD values, turn on Show Frequency across all tick boxes, then click SAVE.
Step 3: Add a frequency value and any justifications to every threat, barrier and consequence. All elements need a value for the top event to be calculated. Click an element and select LOPA to add them.
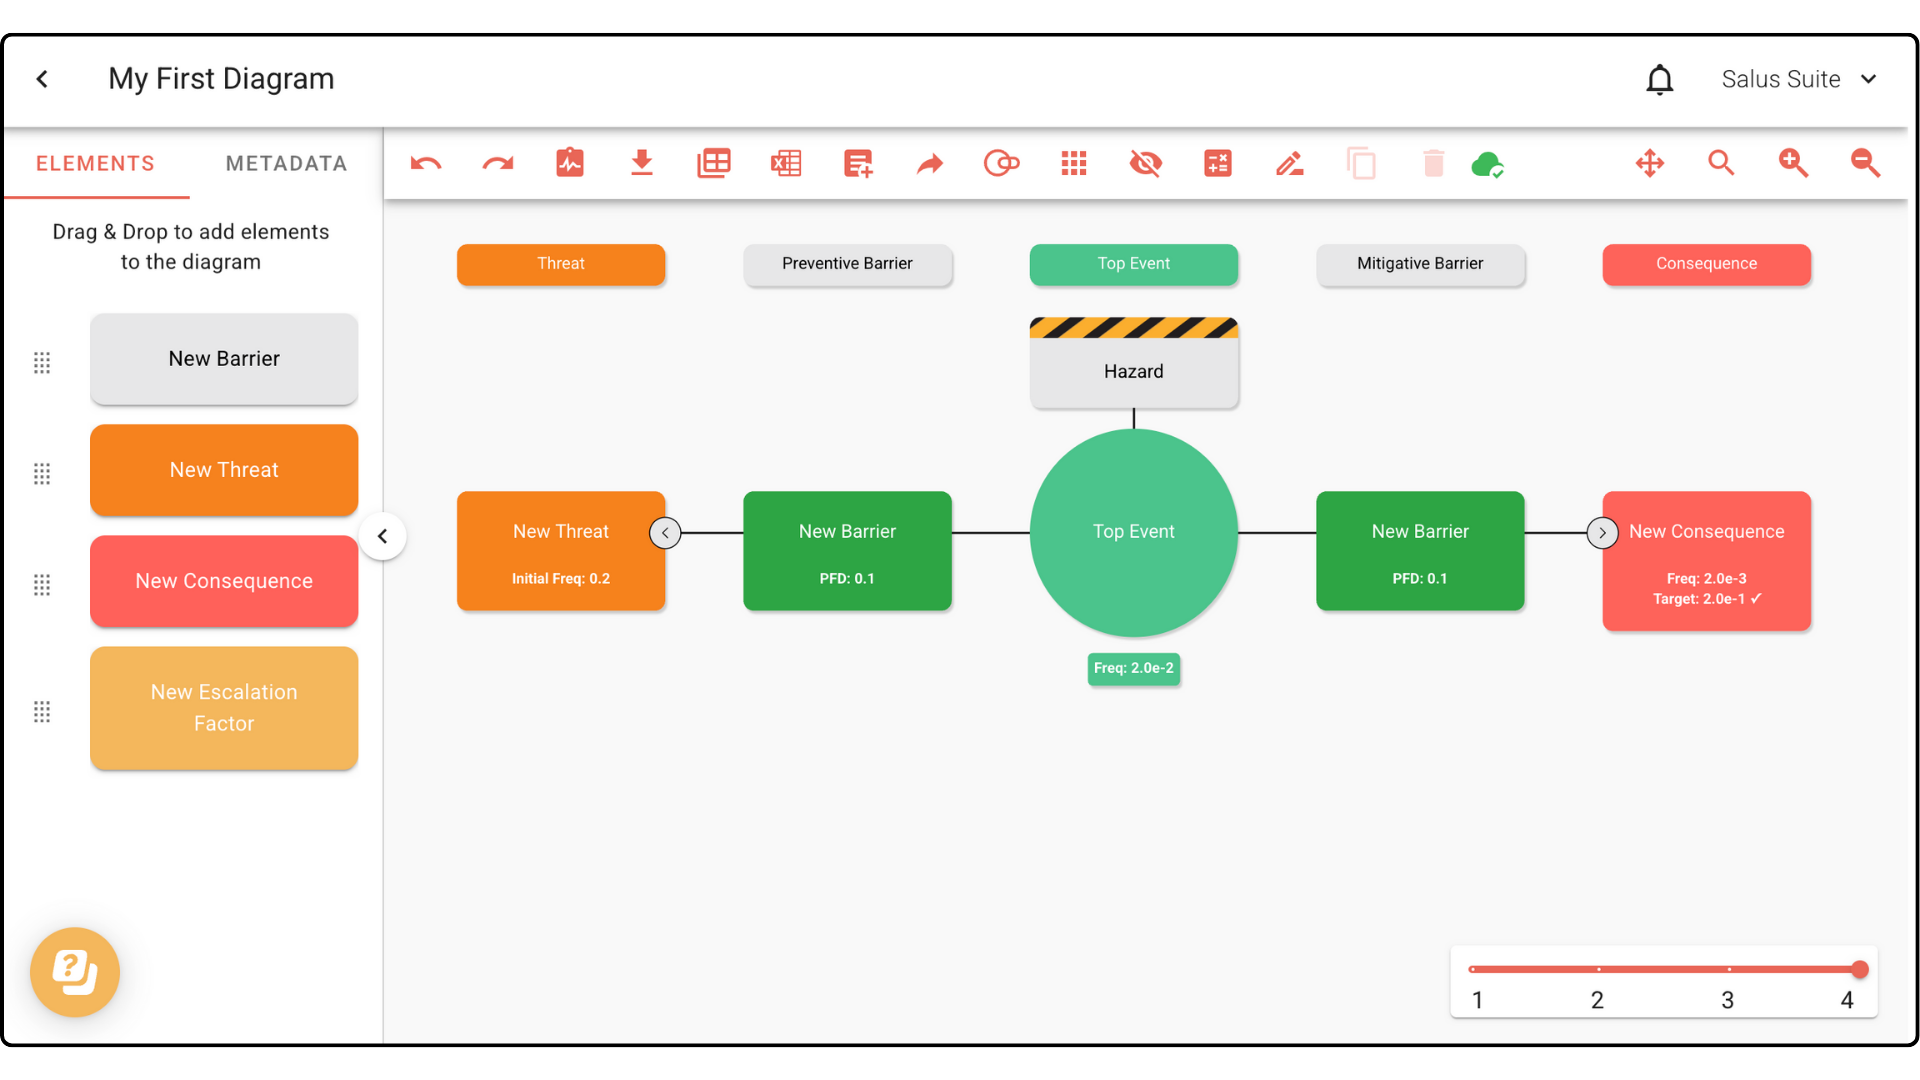
Step 4: Once every value is filled in, the frequency of the top event occurring is calculated and shown in the green rectangle below the top event.

Colour code barrier failure rates
Step 1: Click LOPA, then TOGGLE PFD ANALYSIS.

Step 2: Your diagram enters PFD Analysis mode. Elements are coloured using a traffic-light system, based on the Good and Bad PFD ranges set in the LOPA settings.
Step 3: To exit, click LOPA, then TOGGLE PFD ANALYSIS again. The diagram reverts to its original colours.
Compare consequences to target frequencies
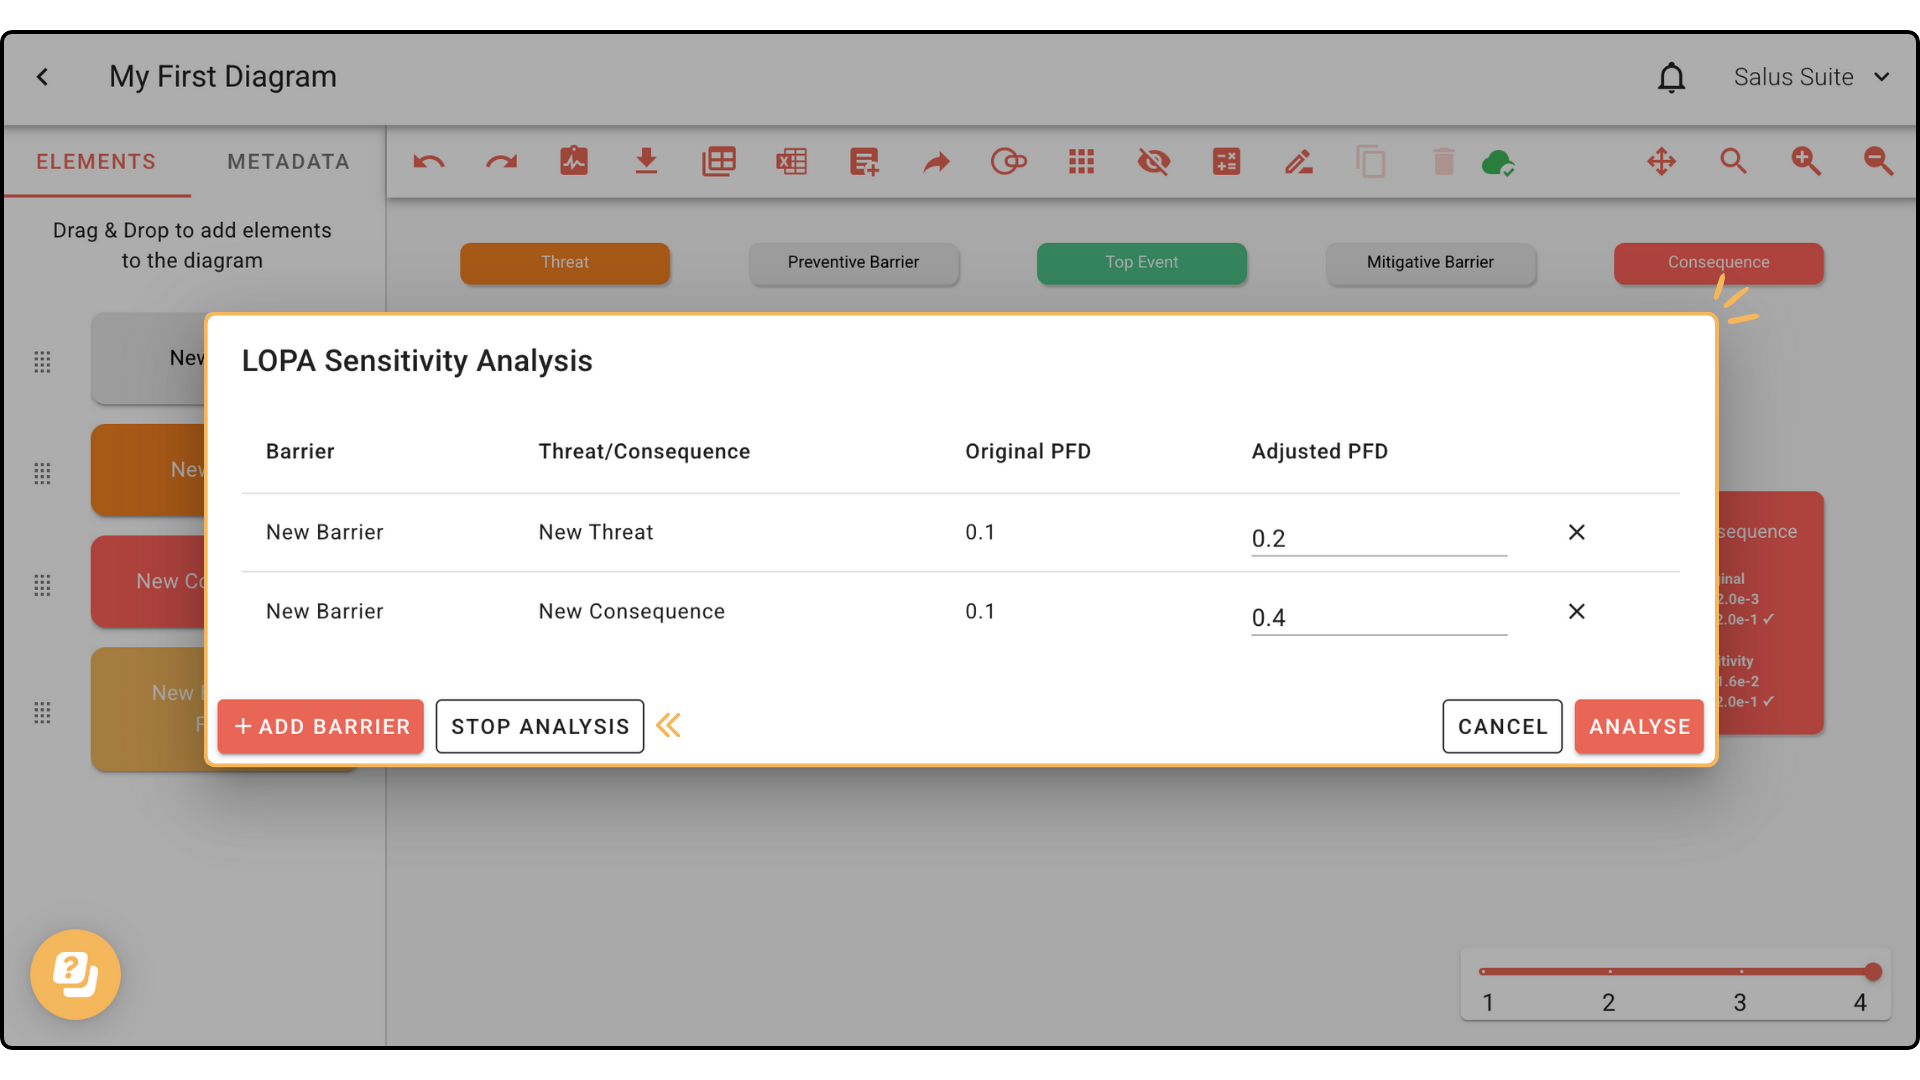
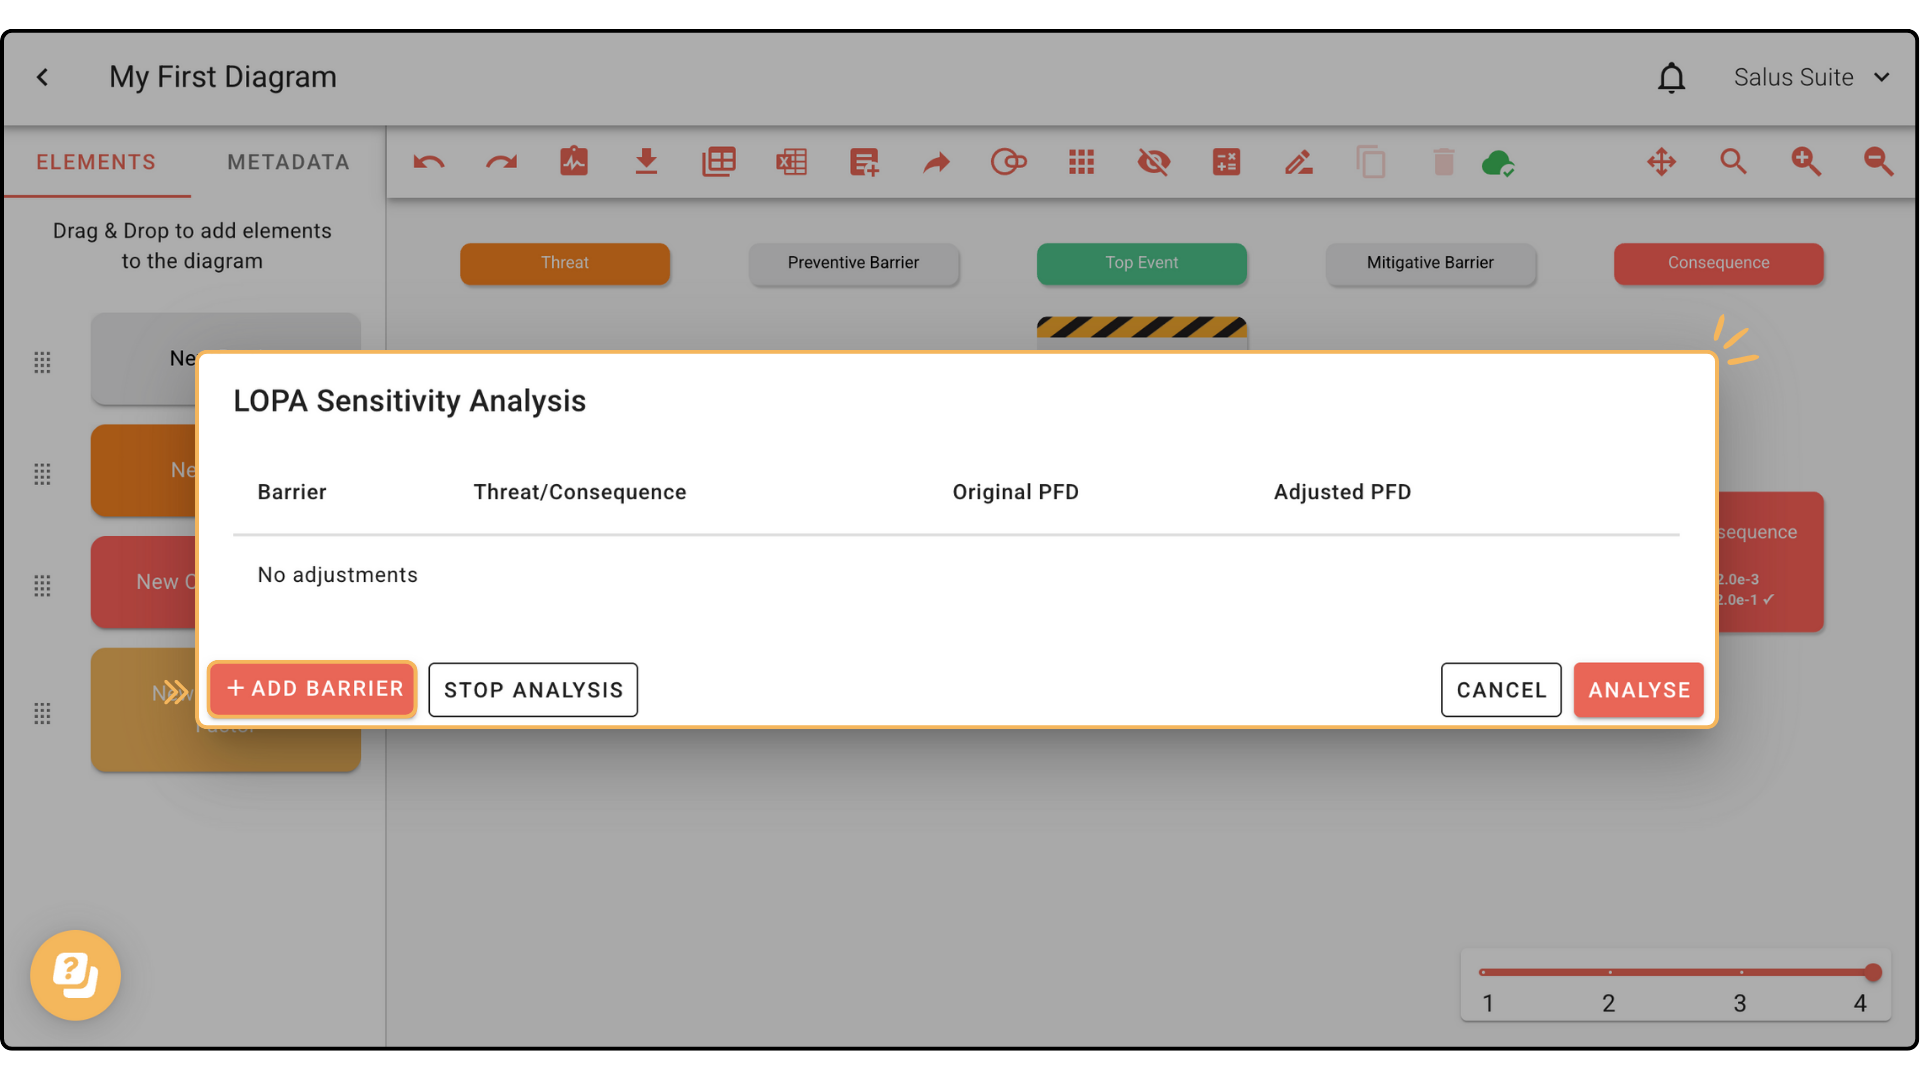
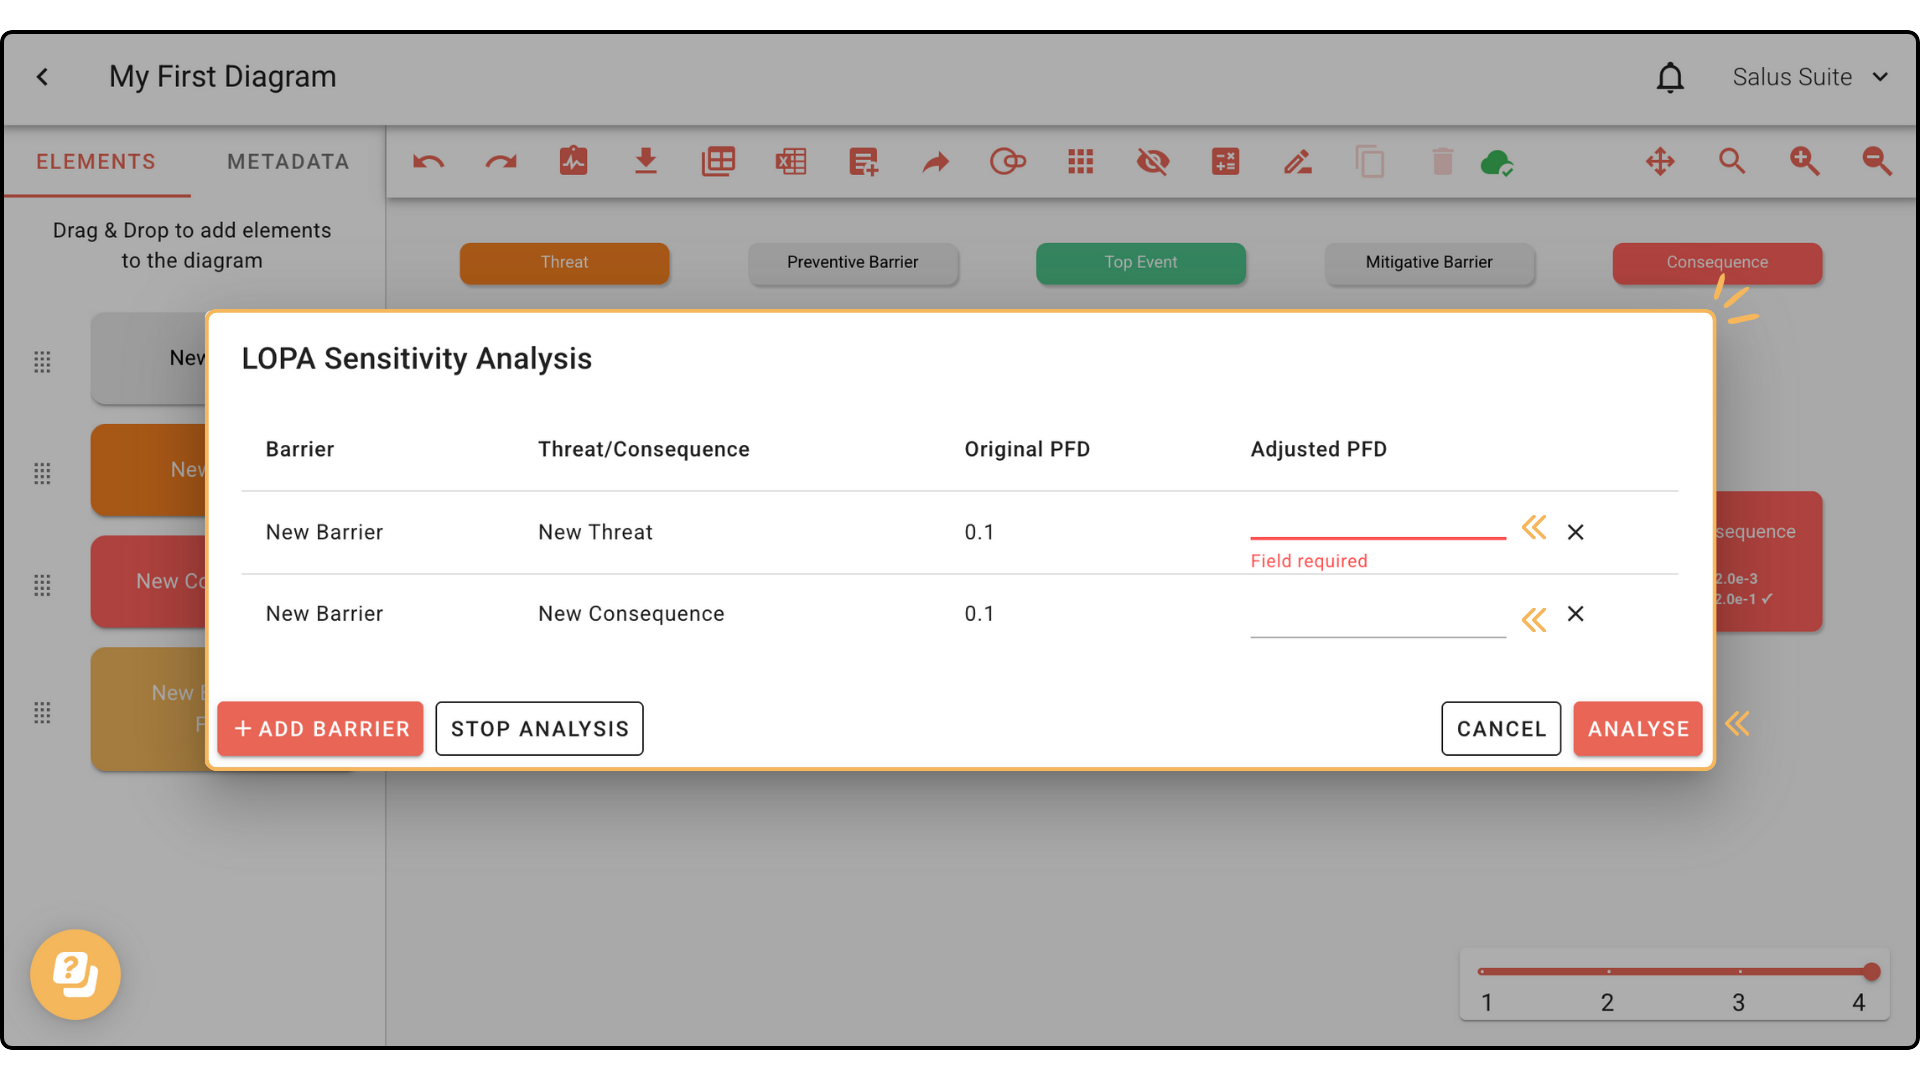
Step 1: Click LOPA, then SENSITIVITY ANALYSIS.
Step 2: In the pop-up, click + ADD BARRIER.
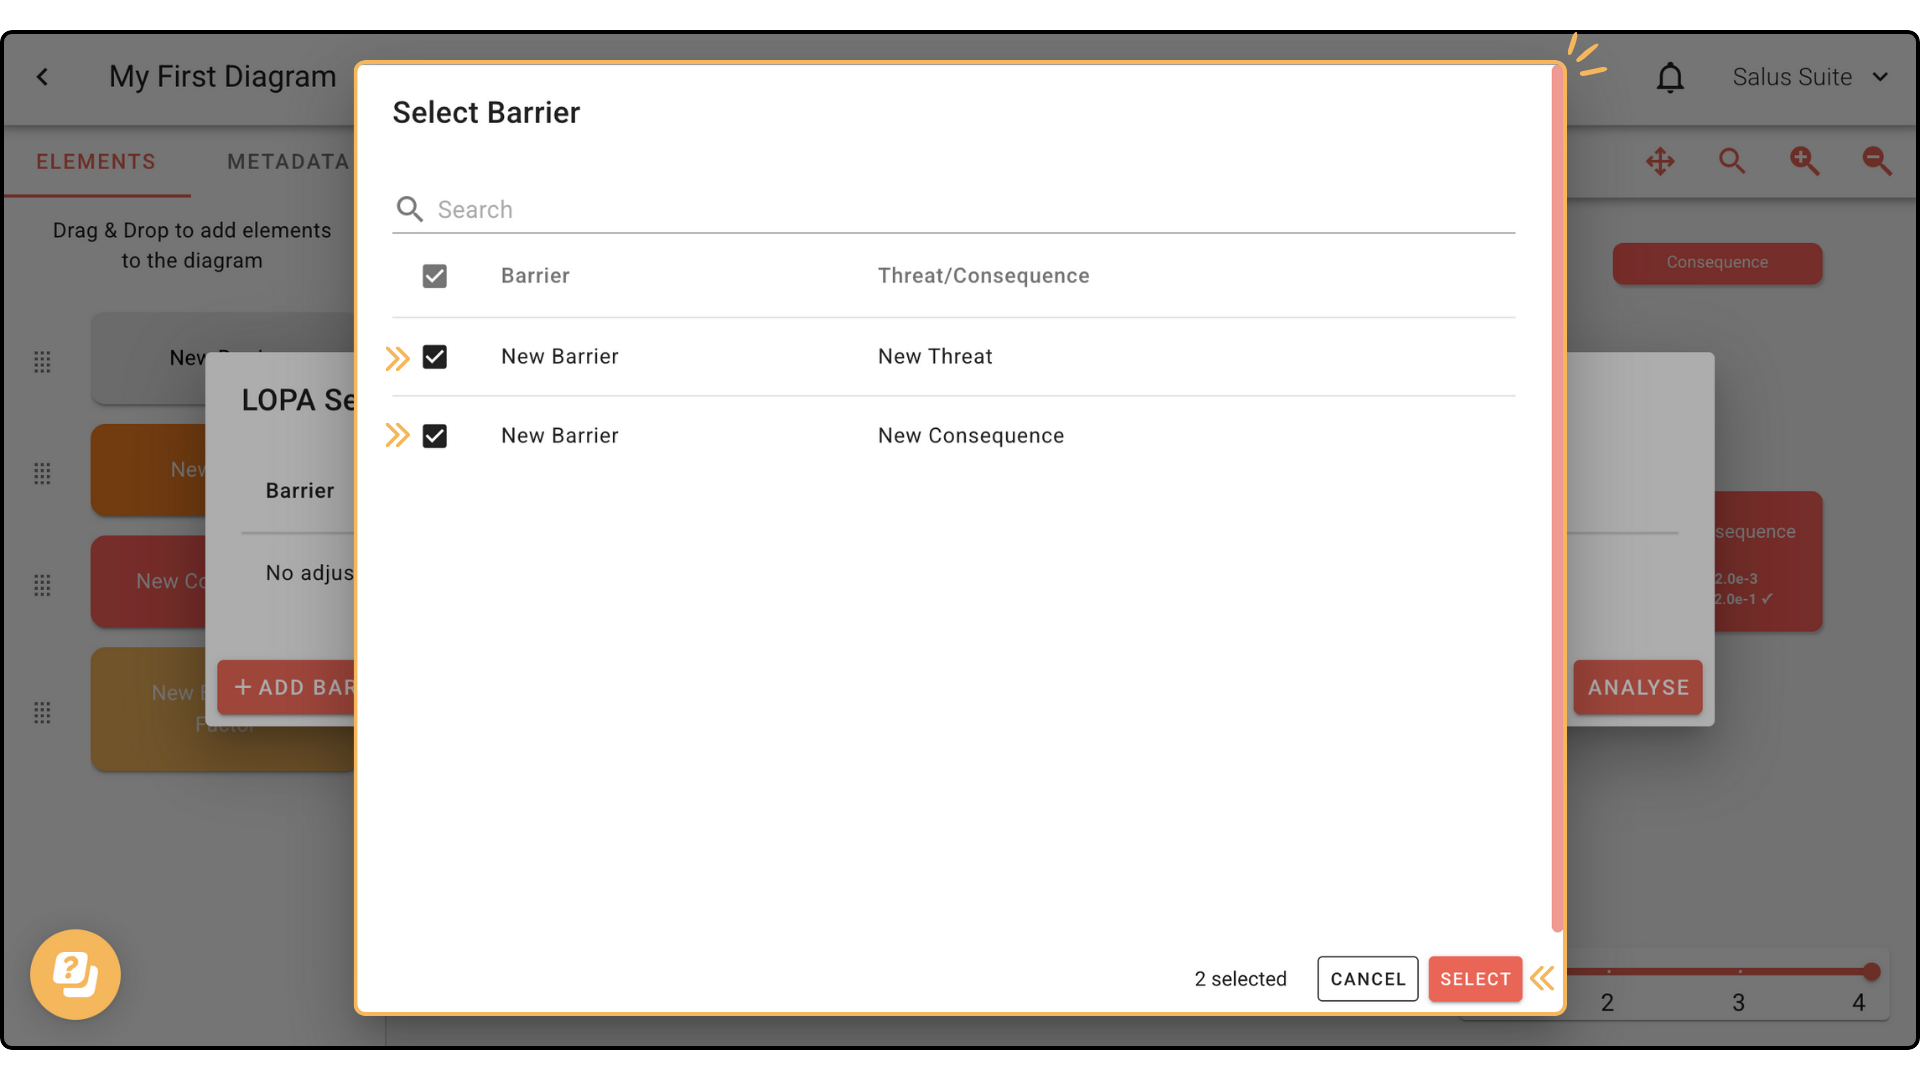
Step 3: Tick the barriers to include, then click SELECT.
Step 4: Add the adjusted PFD values, then click ANALYSE.
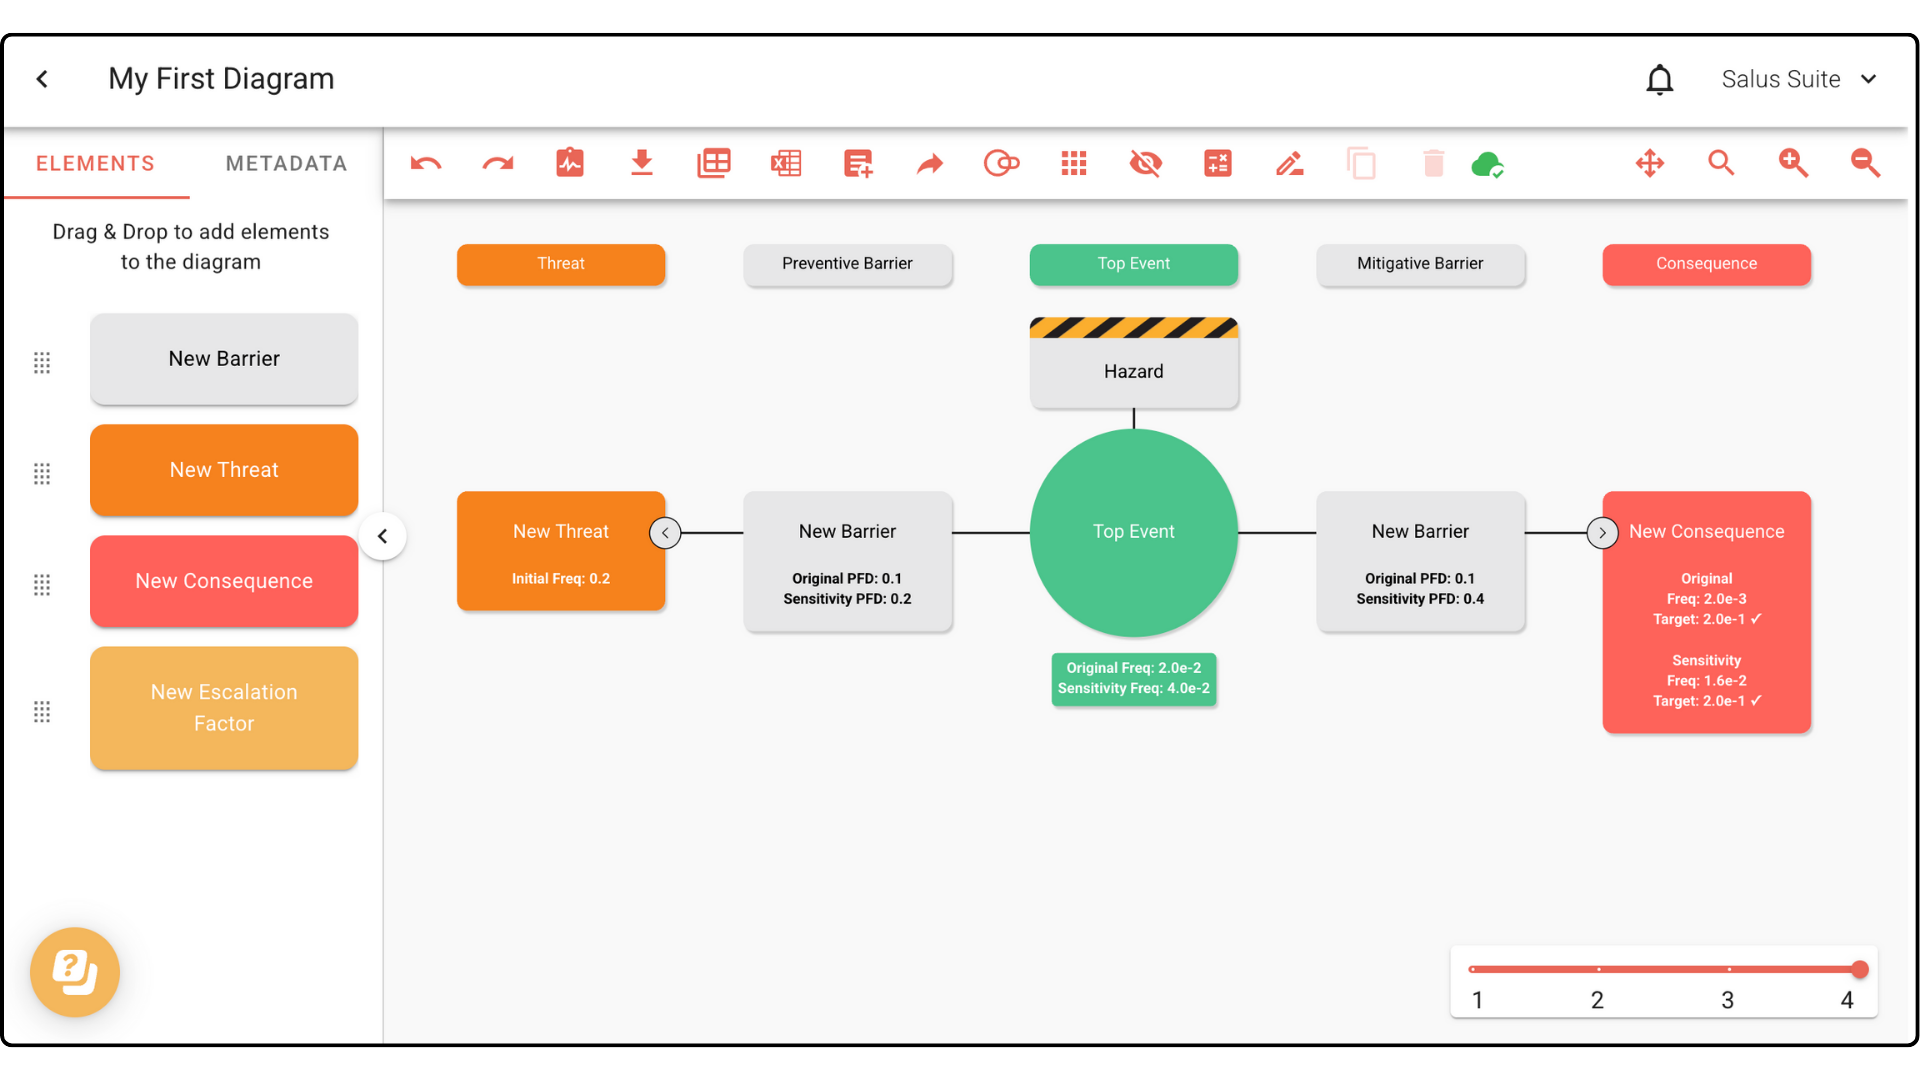
Your diagram shows both the Original PFD and Sensitivity PFD values on the selected elements.
Step 5: To stop, click LOPA, then SENSITIVITY ANALYSIS, then STOP ANALYSIS in the pop-up.